Child Table Data in Columns
Introduction
An example of a report that shows the child table values in a single row with the parent data. Also, columns can be dynamic.
Use Case
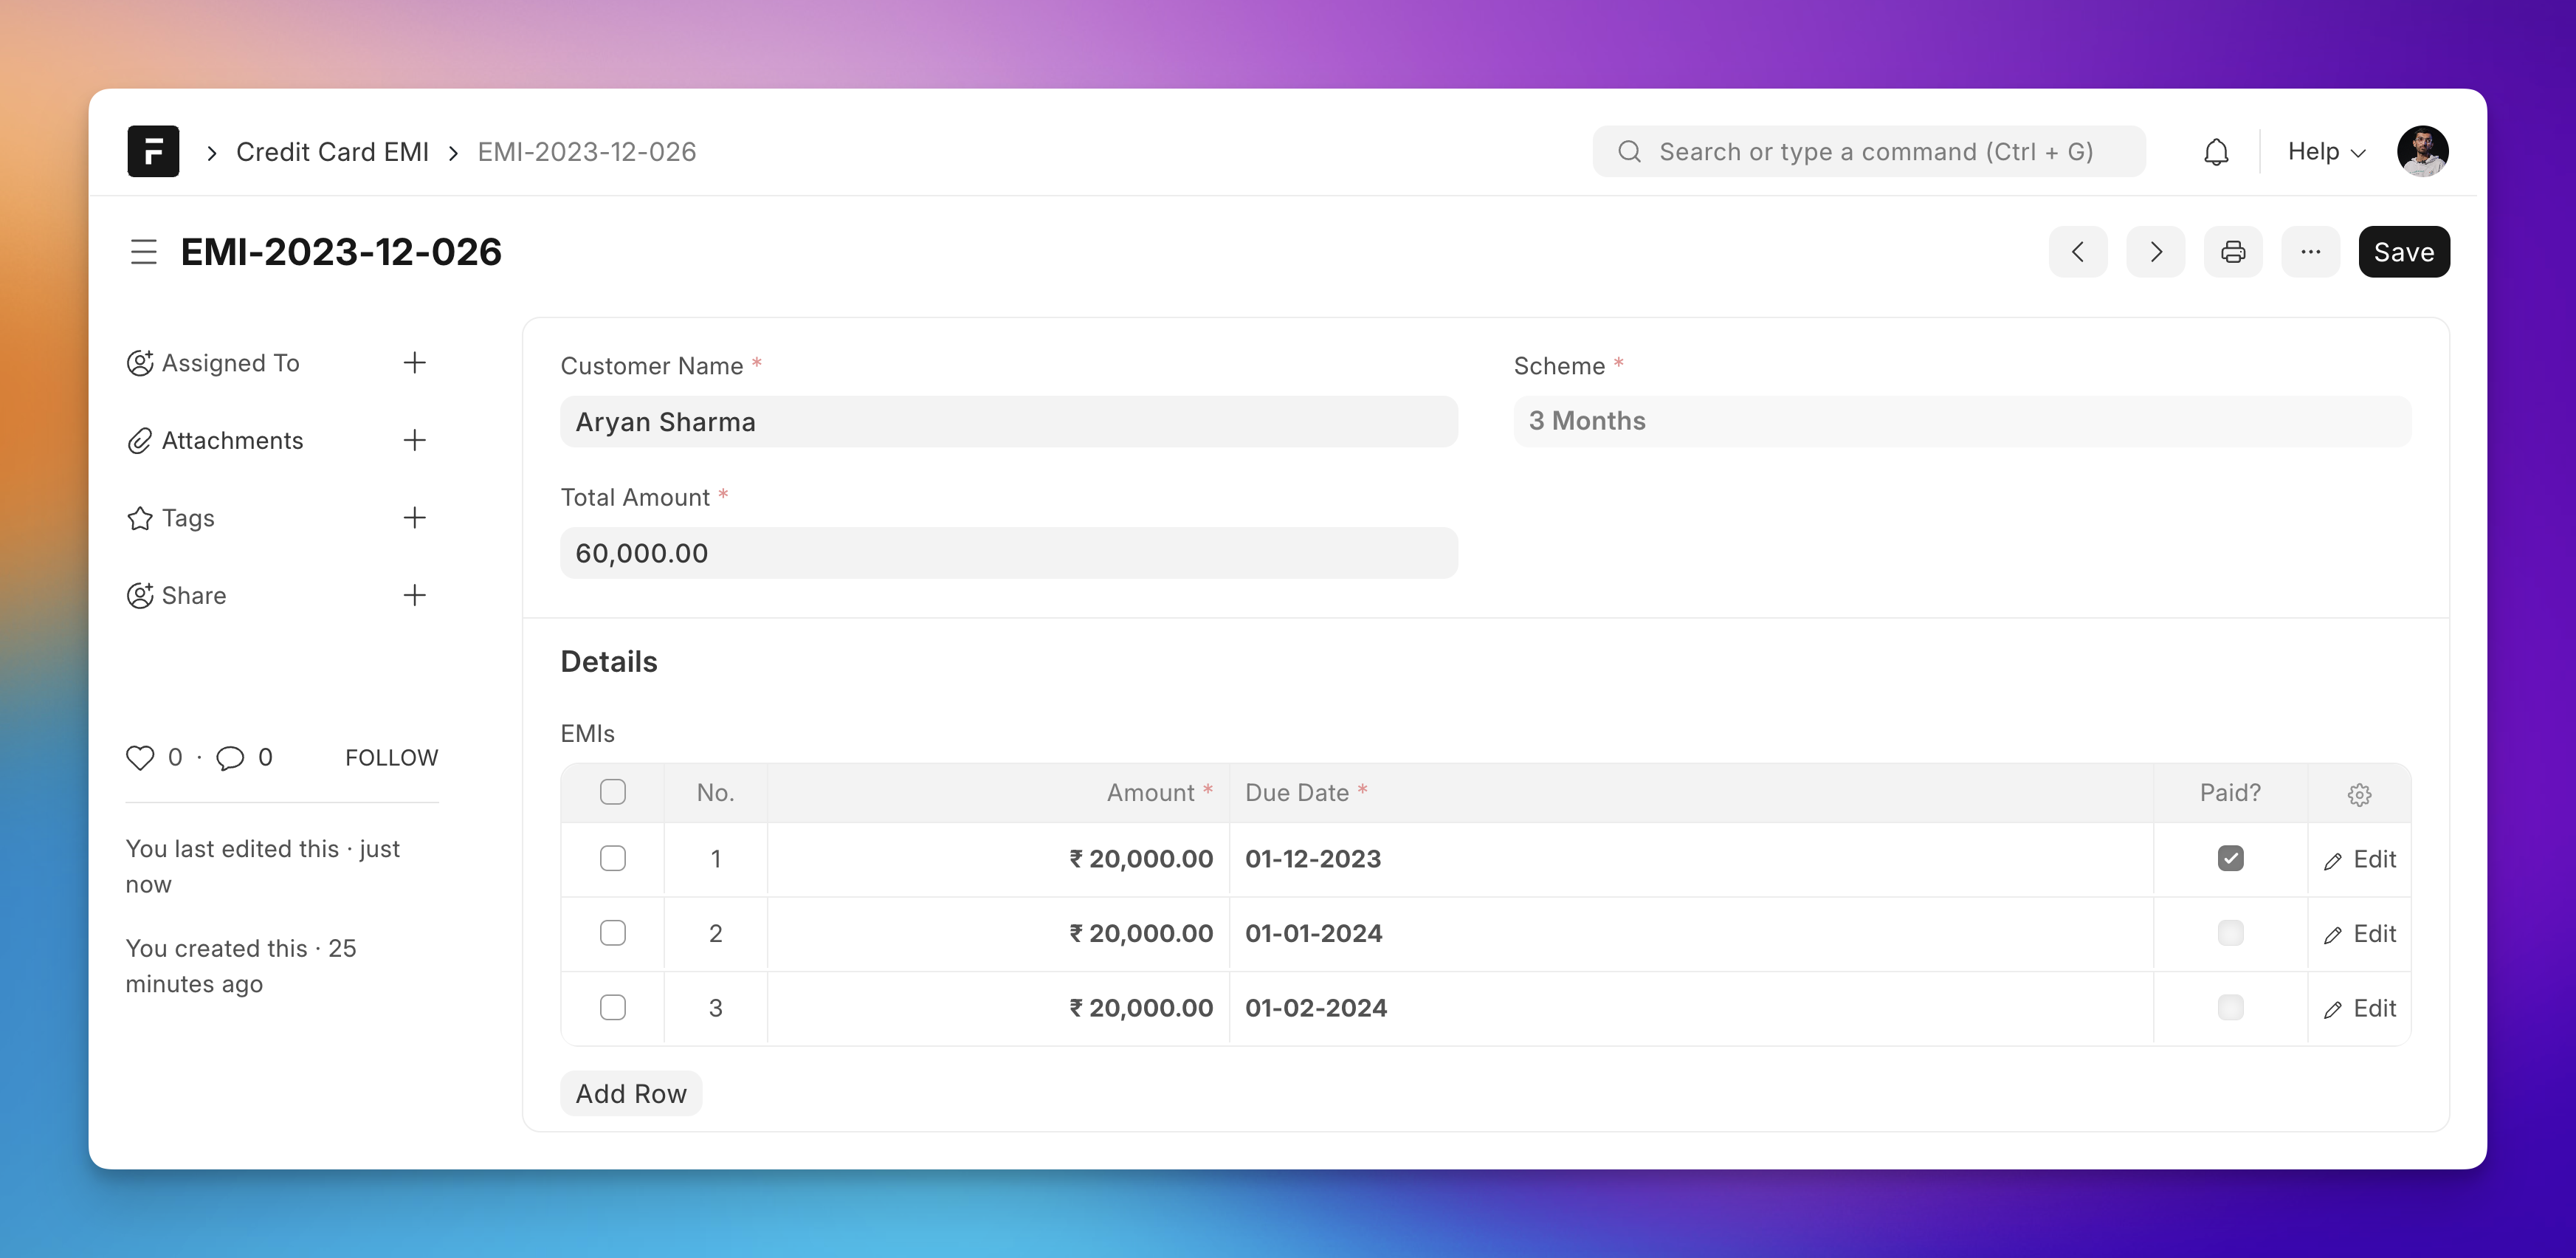
Suppose we have a demo DocType named Credit Card EMI which has the following fields:
- Customer Name
- Total Amount
- Scheme: 3/6/12 Months
- EMIs: Child table with EMIs based on the scheme
Here is a screenshot showing the form view:

The Report
We want to create a report that has this EMIs in different columns, like shown below:

The Script
import frappe
# maximum number of EMIs for a Credit Card EMI# case when EMI is paid in 1 yearNUM_MAX_EMI = 12

def execute(filters=None): columns = get_columns() data = get_data(filters)
 return columns, data

def get_columns(): columns = [  {   "label": "Credit Card EMI",   "fieldname": "credit_card_emi",   "fieldtype": "Link",   "options": "Credit Card EMI",  },  {   "label": "Customer Name",   "fieldname": "customer_name",   "fieldtype": "Data",  },  {   "label": "Scheme",   "fieldname": "scheme",   "fieldtype": "Data",  }, ]
 # 1 column for each EMI for i in range(1, NUM_MAX_EMI + 1):  columns.append(   {    "label": "EMI {}".format(i),    "fieldname": "emi_{}".format(i),    "fieldtype": "Data",    "options": "EMI",   }  )
 return columns

def get_data(filters=None): data = []
 credit_card_emis = frappe.get_all(  "Credit Card EMI", fields=["name", "customer_name", "scheme"] )
 for credit_card_emi in credit_card_emis:  row = {   "credit_card_emi": credit_card_emi.name,   "customer_name": credit_card_emi.customer_name,   "scheme": credit_card_emi.scheme,  }
  # get all EMIs (child items) for the Credit Card EMI  emis = frappe.get_all(   "EMI",   fields=["amount", "due_date", "paid", "idx"],   filters={"parent": credit_card_emi.name},  )
  # e.g. emi_1 = 1000, emi_2 = 2000, emi_3 = 3000, etc.  for emi in emis:   row["emi_{}".format(emi.idx)] = format_currency(emi.amount)
  # set rest of the EMI columns to "-"  for i in range(1, MAX_EMI + 1):   if "emi_{}".format(i) not in row:    row["emi_{}".format(i)] = "-"
  data.append(row)
 return data

def format_currency(value, currency="INR"): return frappe.format_value(value, df={"fieldtype": "Currency"}, currency=currency)
Optimizing The Data Fetching
If you observe the get_data() method, you will see we are calling the frappe.get_all method to get child items for each Credit Card EMI doc, which means 1 DB call per document (O(n) in computer sciency terms).
We can use the Query Builder to reduce this to just one database call (query is highlighted):
def get_data_with_qb(filters=None): data = [] credit_card_emi = frappe.qb.DocType("Credit Card EMI") emi = frappe.qb.DocType("EMI")
 query = (  frappe.qb.from_(emi)  .join(credit_card_emi)  .on(emi.parent == credit_card_emi.name)  .select(   credit_card_emi.name.as_("credit_card_emi"),   credit_card_emi.customer_name,   credit_card_emi.scheme,   emi.amount,   emi.due_date,   emi.paid,   emi.idx,  ) )
 emi_items = query.run(as_dict=True)
 # group EMI items by Credit Card EMI credit_card_emi_items = {} for emi_item in emi_items:  credit_card_emi_items.setdefault(emi_item.credit_card_emi, []).append(emi_item)
 # create a row for each Credit Card EMI for credit_card_emi, emi_items in credit_card_emi_items.items():  row = {   "credit_card_emi": credit_card_emi,   "customer_name": emi_items[0].customer_name,   "scheme": emi_items[0].scheme,  }
  # create a column for each EMI  for emi_item in emi_items:   row["emi_{}".format(emi_item.idx)] = format_currency(emi_item.amount)
  # set rest of the EMI columns to "-"  for i in range(1, MAX_EMI + 1):   if "emi_{}".format(i) not in row:    row["emi_{}".format(i)] = "-"
  data.append(row)
 return data
We had to add more data processing on the Python side though.

